View: Bearish
Target Price: $60-63/bb
Downtrend holds in a tense and murky market.
Brent is drifting with no real trend and bearish momentum. We anticipate the downtrend to continue and Feb’25 to end the week between $60-63.00/bbl. Geopolitically, there are no clear sell signals from the ceasefire and little buying support from growing worries of supply disruption at the hands of Americans in Venezuela.
- Geopolitical tensions
- Lack of fundamental clarity
- Trendless technicals
Geopolitical Tensions
A resolution between Russia and Ukraine remains elusive. Ukrainian and US officials met in Florida to promote a peace plan and security guarantees for Kyiv. U.S. Secretary of State Marco Rubio called the talks “productive” but said the process is “delicate” and relies on Russia. The meeting, with Jared Kushner and envoy Steve Witkoff, follows Geneva talks aimed at revising an earlier draft criticised as too friendly to Moscow. Russia continues attacking Ukrainian cities, while Kyiv reportedly targets Russian oil infrastructure in the Black Sea to weaken Moscow. The Caspian Pipeline Consortium (CPC), which ships over 1% of global oil and 80% of Kazakhstan’s crude, halted operations after a drone strike damaged its Single-Point Mooring 2 at Novorossiysk on 29 November.
Shipping will resume once drone and USV threats are gone. This was the third attack on CPC this year, which US oil companies Chevron and ExxonMobil call a “terrorist attack. ” Kazakhstan condemned the strike, called CPC a “civilian facility,” and warned it could harm relations. Ukrainian sea drones also bombed two vessels in international waters, expanding the conflict zone and pushing away a bearish resolution. Venezuela requested OPEC’s assistance in response to US hostility. Maduro claimed, “The United States is planning to plunder Venezuelan oil… they want to seize the largest oil reserve in the world”. Currently, Venezuela’s production is around 940kb/d, with 620kb/d exported to China. We would expect any increase in conflict to lead to a decline in production and exports. China opposed US sanctions on Venezuela, including designating Cartel de los Soles as a terrorist group, calling for sanctions to be lifted to promote regional stability.
Lack of Fundamental Clarity
OPEC+ confirmed it will keep oil production unchanged through early 2026 with independent verification of each member’s Maximum Sustainable Capacity, providing accurate spare capacity data for the first time. This transparency aims to improve negotiations, with Saudi Energy Minister Prince Abdulaziz bin Salman stating the goal is for the world to know “what is actually left.” This marks a shift following criticism of unwinds as ‘paper’ measures, which have undermined the cuts that have taken place. These paper barrels continue to cloud the market with a significant 660kb/d downwards revision to US crude supply for September.
The US has not been reaching its estimates of new all-time highs for crude production, and this could raise some questions about the validity of the supply glut narrative. The monthly report also estimated US oil demand to be up 2.6% year-over-year. This looks bullish, but it adds to the overall confusing fundamental picture. It seems OPEC is taking measures to accept the market’s lack of trust in their numbers, but the EIA is proving hard to buy into, too…
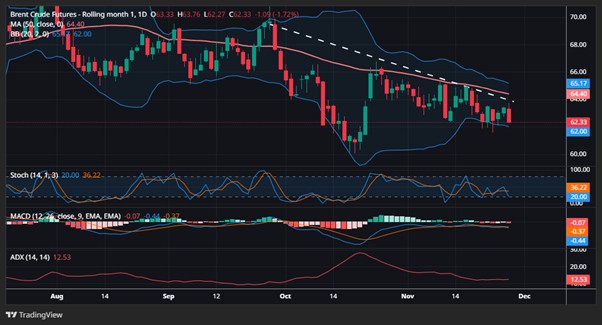
Trendless Technicals
The murky geopolitics of the widening conflict between Russia and Ukraine, and the worrying increase in tensions between the US and Venezuela, cloud the picture fundamentally. Thus, moving to the technical view, M1 Brent futures lacks a solid trend, although it remains bound by a downtrend line from the end of September (white dashed line), which indicates a clear pattern of lower highs. There is an incredibly weak trend in the market, with volatility trending sideways and the daily candles showing small intraday ranges. Momentum is bearish, and growing as per MACD, showing an increasingly negative histogram and the stochastics having a bearish crossover.
However, these are not very strong signals with the MACD and signal line very close together, while the stochastics indicator has seen many crossovers, which undermines its validity as a sell signal. Technically, there is little to point to a breakout in either direction, with the trendline and 50-day moving average proving strong resistance in the past month or two. It seems like the downtrend is intact, if very weak.